Understanding candidate disease gene predictions 
Common Pathway Scanning (CPS)
CPS is based on the assumption that common phenotypes are associated with
proteins that participate in the same complex or pathway (1). CPS applies
protein-protein interaction data from the I2D database and pathway data
from KEGG and BioCarta to identify relationships between known disease
genes and genes in the disease interval.
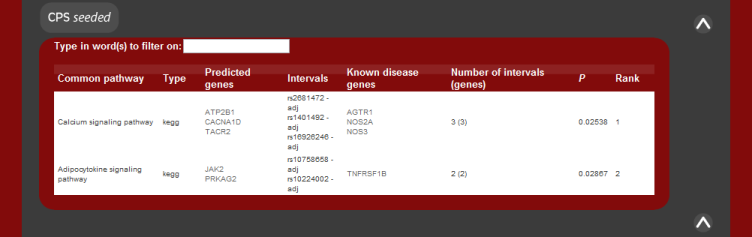
The results of the predictions are grouped by the common pathway or common
protein that the candidates share with the known disease genes. These are
listed along with the significance of the result and the given rank of the
pathway. The P value of the pathway result is the fisher's exact test
statistic for a 1-tailed test.
There is currently no score for the protein-protein interaction results.
The image below shows how the results should appear given the system returns predictions.
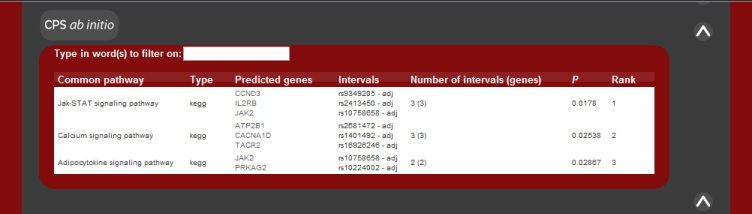
Further to using known disease gene information to link genes and make
predictions, the ab initio mode or multiple interval mode searches for
enrichment of pathways amongst the genes in the candidate list.
As in the case of known disease genes, the results are listed according to
common pathway or protein interaction. The pathways are also ranked and the P value of the pathway result is also the fisher's exact test statistic for a 1-tailed test.
There is currently no score for the protein-protein interaction results.
The image below shows how the results should appear given the system returns
predictions.

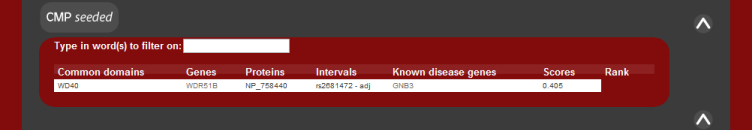
Common Module Profiling (CMP)
CMP uses a domain-based approach to identify genes with a potential
functional similarity to known disease genes and is based on the hypothesis
that genes of similar function will lead to the same phenotype (2). Gentrepid
contains precalculated Pfam-domain annotation for all genes. CMP compares
the domain content of each protein within a disease interval to identify
putative disease genes. Each protein observed to have disease-like domains is
assigned a score based on the sequence similarity between the domains.
The image below describes what the results should appear as.
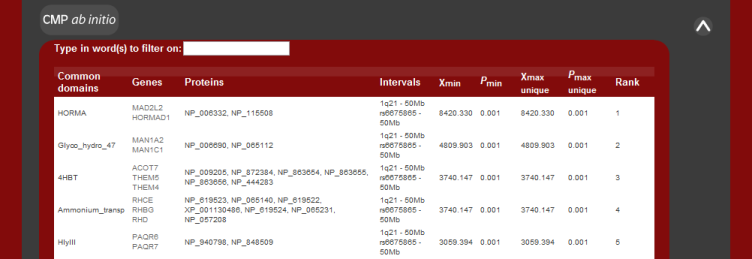
For ab initio mode, the enrichment of domains is calculated
by performing a Χ2 square test.
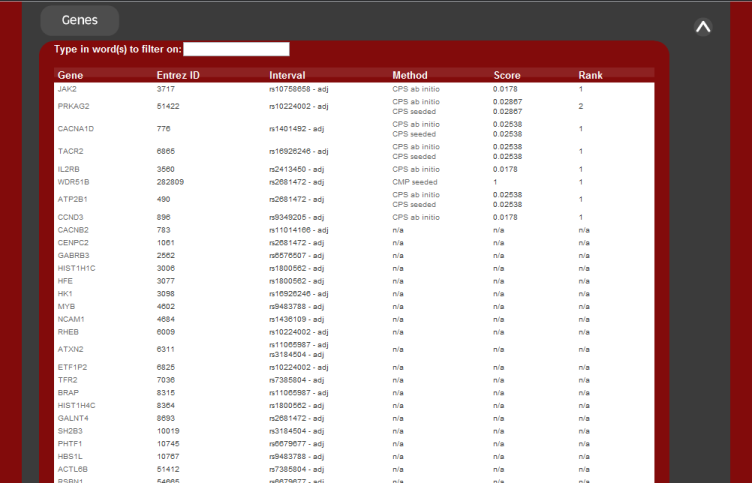
Output: candidate genes
As the main goal of the system is to return the most likely candidate disease
genes for the inputed genetic intervals, two summary output results are
returned.
The first is the list of candidate disease genes. These are ranked.
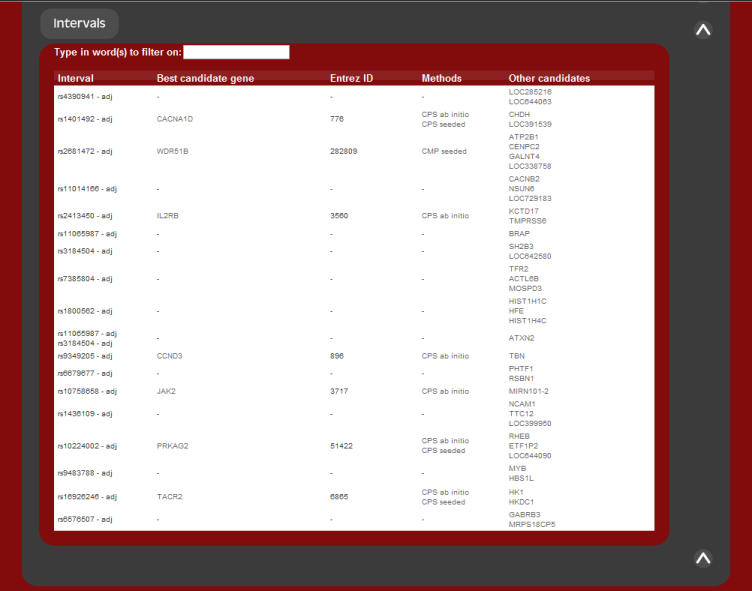
The second summary output is the list of candidates returned sorted by genetic
marker. For each genetic loci inputed, the most likely candidate gene is given,
along with all other candidates associated by that region.
|